IPTraf is a console-based network statistics utility for Linux. It gathers a variety of figures such as TCP connection packet and byte counts, interface statistics and activity indicators, TCP/UDP traffic breakdowns, and LAN station packet and byte counts. IPTraf is an IP traffic monitor that shows information on the IP traffic passing over your network. IPTraf is very easy to use with the easy to use menus and the simplicity of configurations (if changing from defaults) makes it a real nice command-line network utility. IPTraf is a root only utility and cannot be run by standard users.
Protocols supported are IP, TCP, UDP, ICMP, IGMP, IGP, IGRP, OSPF, ARP, RARP and supports Loopback, Ethernet, FDDI, SLIP, Asynchronus PPP, Synchronus PPP over ISDN, ISDN with RAW IP & Cisco HDLC Encapsulation and Parallel line IP.
Highlighting Features
Includes TCP flag information, packet and byte counts, ICMP details, OSPF packet types.
General and detailed interface statistics showing IP, TCP, UDP, ICMP, non-IP and other IP packet counts, IP checksum errors, interface activity, packet size counts.
A TCP and UDP service monitor showing counts of incoming and outgoing packets for common TCP and UDP application ports
A LAN statistics module that discovers active hosts and shows statistics showing the data activity on them
TCP, UDP, and other protocol display filters, allowing you to view only traffic you’re interested in.
Support for logging
Supports Ethernet, FDDI, ISDN, SLIP, PPP, and loopback interface types.
Utilizes the built-in raw socket interface of the Linux kernel, allowing it to be used over a wide range of supported network cards.
Install IPTraf
To install IPTraf on your openSUSE, click one of the following 1-click installers based on your openSUSE version.
openSUSE 11.1 (iptraf-3.0.0-138.7)
![]()
openSUSE 11.0 (iptraf-3.0.0-114.1)
![]()
openSUSE 10.3 (iptraf-3.0.0-76)
![]()
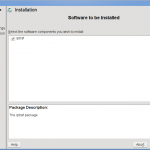
This should download the YMP file and launch YaST to start the installation. Click Next on the Additional Repositories window and Next on Software to be installed window and finally Next on the installation proposal window. Click Finish when the software install successfully completes.


This should install iptraf under /usr/sbin/iptraf
linux-pa5r:~ # which iptraf
/usr/sbin/iptraf
To start the utility, simply run “iptraf” from a terminal window to launch the Network monitoring console. Press any key to get the menu items. You can see a list of possible monitoring options inlucing thr live IP traffix monitor, a detailed and a general interface statiustics, Statistical breakdowns and LAN station monitor.


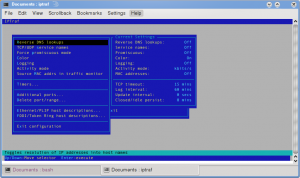
Before, you start monitoring, select “configure” from the menu and enable the options you would consider useful like Reverse DNS Lookup, TCP Service Names. To turn ON the option or to get its submenu, simply press Enter. You are also presented with keyboard shortcuts the good old way at the bottom of the screen. Once done with the configuration, exit and choose your monitoring option.
The IP Traffic Monitor shows real-time IP Traffic on the selected interfaces.
While Interface statistics (general & detailed) shows the number of packets, differentiting IP and Non-IP traffic and total bytes/bits in and out of the interfaces choosen.
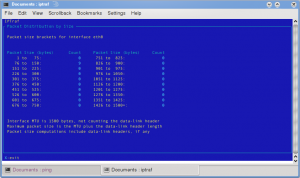
A nice breakdown of the packets based on its size or by the TCP or UDP ports is provided by the Statistical breakdown options.


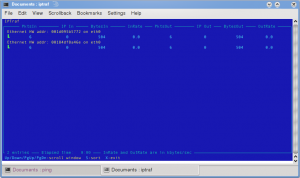
You can also choose to view the LAN monitor with the ethernet address of the end devices, IP packets in/out and Bytes/bits in/out etc.

Overall, IPTraf a very nicely done efficient console based Network Monitoring utility. Click here to visit the project homepage.


